Is an Automatic Cartoning Machine Worth the Investment? ROl Calc
In pharmaceutical, food, and consumer goods packaging, line managers often face a core decision: continue with manual cartoning, or upgrade to an automatic cartoning machine? The hesitation is understandable – an automatic cartoner typically requires a six‑ to seven‑figure initial investment. But whether it is “worth it” depends on your plant’s output volume, labour cost structure, and overall line bottleneck.
This article provides a five‑step quantitative framework to help you build a data‑supported business case before submitting your investment proposal.
First, Ask the Right Question: “What Are We Losing Right Now?”
Before calculating ROI for an automatic cartoning machine, you need to answer a more fundamental question: How much hidden loss does manual cartoning cost your business every day? These losses exist on at least three levels.
1. Direct Cost: Labour Gap and Workforce Expenses
A typical reference point comes from actual production statistics in Chinese pharmaceutical companies: on a manual cartoning line running at about 60 cartons/min, 4 people per shift are generally required (including leaflet folding and batch printing). To reach 120 cartons/min, 9 people per shift are needed. From a cost perspective, the cartoning step accounts for roughly 5–6% of total product packaging cost.
Internationally, the numbers are even more striking. In Australia, the fully loaded cost of one manual cartoning operator (wages, pension, workers’ compensation, etc.) is about AUD 55,000–75,000 per year, while the price of an automatic cartoning machine ranges from AUD 30,000 to 120,000 – meaning that one year’s labour cost can cover an entry‑level machine. Although absolute figures differ in China, the “multiplication effect” is equally worth watching.
When you need to add shifts to meet output targets, labour costs multiply. Two shifts roughly double the cartoning labour cost; three shifts triple it.
2. Output Cost: Bottleneck Means Lost Order Opportunities
One of the core values of automated packaging equipment is hourly output of roughly 150–200+ cartons, which is difficult for manual labour to sustain over long periods. An industry ROI analysis notes that most packaging automation projects achieve payback within 6 months to 2 years – high‑volume, labour‑intensive operations can see payback in as little as 6–12 months.
More importantly, the slowest station on the line determines total output – and that is often the cartoning station. When cartoning becomes the bottleneck, upstream packaging and downstream warehousing are both constrained. In other words, by “saving” equipment investment on manual cartoning, you may be losing the ability to accept large orders.
3. Compliance Cost: Quality Standards and Recall Risk
In the pharmaceutical industry, GMP standards are becoming stricter. According to the core requirements of EU GMP Annex 1, human intervention in pharmaceutical production should be minimised; any necessary glove interventions must undergo rigorous risk analysis and be described in a contamination control strategy. Regulatory bodies such as the FDA and EMA also mandate serialisation and traceability systems – by 2025, 90% of pharmaceutical products in the US are required to have serialisation, a trend that has driven a more than 25% increase in demand for automated packaging equipment.
Missing leaflets, wrong cartons, or missing batch numbers during manual cartoning are unacceptable risks in a GMP audit. If a product recall occurs, the loss goes far beyond equipment cost – it includes brand reputation and regulatory penalties.
Five‑Step Quantitative Assessment: How to Truly Calculate the ROI of an Automatic Cartoning Machine
Once you understand the structure of losses, you can use quantitative tools for accurate calculation. The following five‑step framework integrates ROI methods commonly used in the packaging industry.
Step 1: Calculate Total Investment Cost
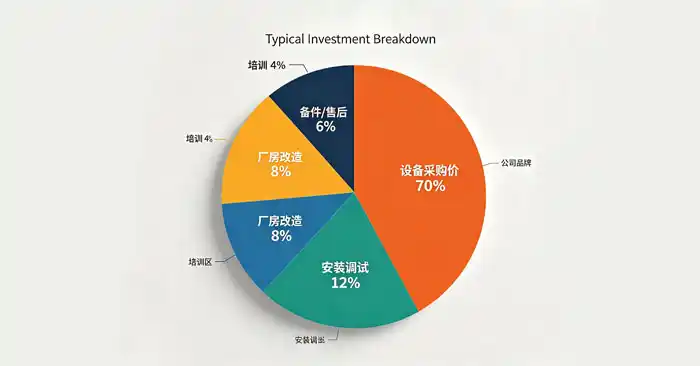
Total investment cost must include all associated expenses beyond the machine itself. Many companies only see the “machine price” and overlook these additional costs:
| Cost Item | Explanation | Estimated Percentage |
|---|---|---|
| Equipment purchase price | Base price of the automatic cartoner | ~65%–75% |
| Installation & commissioning | On‑site installation and line integration | ~10%–15% |
| Operator training | Training for operators and maintenance staff | ~3%–5% |
| Facility / space modification | If line layout changes are needed | ~5%–10% |
| Spare parts & service agreement | Wear parts inventory, annual maintenance | ~2%–5% |
Total Investment = Equipment + Installation + Training + Modification + Spares
Step 2: Quantify Direct Annual Benefit – Labour Savings
This is the most straightforward and easily quantifiable part of the ROI calculation:
Annual labour savings = Baseline annual labour cost − Labour cost under the automated solution
-
If manual cartoning requires 4 operators/shift on two shifts, calculate total loaded cost per operator (wage, social insurance, benefits, training) based on your region.
-
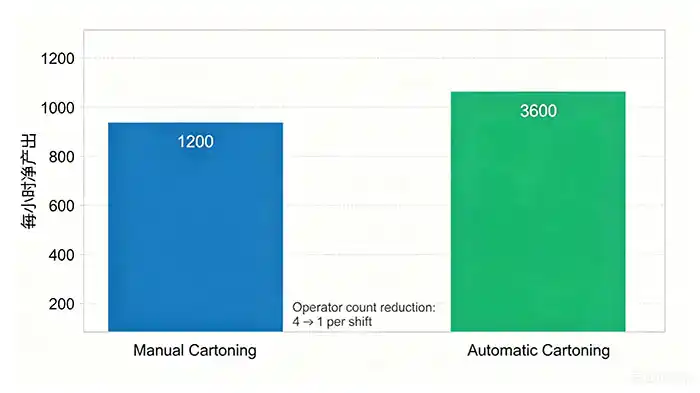
An automatic cartoning machine typically needs only 1 operator per shift to monitor the machine and handle auxiliary tasks, also on two shifts.
-
The annual labour cost saved often creates significant positive cash flow.
Industry examples even show that wage, insurance, and training savings can cover more than 60% of equipment cost within the first year, achieving payback in approximately one year.
Step 3: Quantify Indirect Annual Benefits – Efficiency Gains, Waste Reduction, and Quality Assurance
This part is often overlooked but usually provides the greatest value. It includes three main contributions:
① Increased output value:
Automation typically increases hourly output by 200%–300%. If your original line was already running full days, output can nearly double – and this incremental volume directly translates into fulfilling more orders. Some food processing plants have reported that after upgrading their packaging line, they were able to accept orders they previously had to turn away during peak seasons.
② Material and waste savings:
Automatic cartoners are equipped with multi‑level detection systems (no carton closure if product or leaflet is missing; stoppage if carton is not opened) to effectively avoid material waste. Manual operation normally generates 1–3% waste (paper, cartons), while automation can reduce this to below 0.3%. Every percentage point saved on raw materials is real profit in high‑volume production.
③ The “hidden value” of reduced quality risk:
A single product recall in the pharmaceutical industry can directly cost hundreds of thousands to millions of RMB. Automatic cartoners integrated with barcode recognition and batch code detection provide a final checkpoint in the packaging stage. Under tightening regulatory requirements, this “insurance” value should not be ignored.
Annual total benefit = Labour savings + Incremental output value + Material waste reduction + Quality risk reduction
Step 4: Apply the Formula – Calculate ROI Percentage and Payback Period
ROI and payback period are the two metrics management cares about most:
Formula 1: ROI (Return on Investment)
ROI=Annual total benefitTotal investment×100ROI(%)=Total investmentAnnual total benefit×100
Formula 2: Payback Period
Payback Period (years)=Total investmentAnnual total benefitPayback Period (years)=Annual total benefitTotal investment
Example:
A pharmaceutical company invests RMB 1.2 million and achieves an annual benefit of RMB 550,000:
ROI = 550,000 ÷ 1,200,000 × 100% = 45.8% per year
Payback period = 1,200,000 ÷ 550,000 ≈ 2.18 years
Industry benchmark: In packaging machinery, a payback period of 1.5–3 years is generally considered desirable. For operations with multiple shifts and high base volumes, payback can be compressed to 12–18 months or even less.
Step 5: Re‑evaluate with Hidden Costs – Use a Total Cost of Ownership (TCO) Perspective
All of the above calculations assume an “ideal state”. Total cost of ownership and total life‑cycle value give you the real long‑term picture.
-
Spare parts and maintenance: Typically 2–5% of original equipment cost per year.
-
Energy consumption: Fully automatic equipment may increase energy use, but energy per unit of output usually decreases due to higher throughput.
-
Equipment service life: Usually 8–10 years, over which the investment is amortised.
Using a TCO perspective, sometimes a machine with a slightly higher initial price ends up having a lower total cost of ownership – exactly the information you need for a smart decision.
Comparison Matrix – ROI Structure of Manual vs. Semi‑Automatic vs. Fully Automatic Cartoning
The following comparison shows the suitability of each option under different scenarios:
| Evaluation Aspect | Fully Manual | Semi‑Automatic | Fully Automatic |
|---|---|---|---|
| Speed | 60 | 80–120 | 150–600 |
| Operators per shift | 4–9 persons | 2–3 persons | 1 person |
| Error & waste rate | High | Medium | Low |
| Traceability capability | Dependent on manual records | Partial code detection | Full scanning / serialisation |
| GMP compliance | Challenged in audits | Generally adequate for routine | Fully meets latest standards |
| Investment threshold | Low | Medium | High |
| Payback period | — | 2–3 years | 1.5–3 years |
| Long‑term TCO | Highest | Medium | Lowest |
Practical Examples – Typical Scenarios
Scenario 1: Two‑Shift Pharmaceutical Company
Description: A mid‑sized pharmaceutical company currently uses manual cartoning, two shifts, with 8 operators per shift. Loaded labour cost includes wages, social insurance, training, and quality‑related activities. Equipment price is approx. RMB 1 million, installation and training approx. RMB 200,000, total investment approx. RMB 1.2 million.
Benefit calculation:
-
Labour savings: from 16 persons/day to 2 persons/day → annual saving approx. RMB 700,000.
-
Material savings: waste reduced from 1.5% to 0.5% → annual saving approx. RMB 150,000.
-
Quality risk reduction: fewer packaging complaints and returns → annual saving approx. RMB 100,000.
Total annual benefit approx. RMB 950,000 → Payback period approx. 1.26 years, ROI approx. 79%.
Scenario 2: Food / Consumer Goods Company, Frequent Changeovers
Description: A food company produces multiple product specifications with frequent changeovers. The original line suffered from long manual changeover times, affecting overall OEE.
Benefit calculation:
-
Automatic cartoner with modular changeover design reduces changeover time from 60 minutes to 15–20 minutes per change.
-
Approximately 15 changeovers per month → saves about 10 hours/month → annual incremental output of roughly 2 million pieces.
-
Estimated payback period: approx. 1.8 years.
From Assessment to Decision – Your Next Steps
Using the five‑step framework above, you can achieve three goals:
-
Present quantitative data to management showing the true ROI of an automatic cartoning machine.
-
Assess the “passive opportunity loss” of not automating, given rising labour costs.
-
Prioritise cartoning automation within your overall line upgrade roadmap.
Once you have clarified these key decision factors, comparing the specific specifications of available options becomes the next logical step. You can review high‑speed models for high‑volume scenarios or modular designs that provide greater changeover flexibility.
Related Reading Recommendations
-
How to Tell If Your Line Needs a Full Packaging Line Upgrade
-
Manual vs. Automatic Cartoning: Long‑Term Total Cost Comparison Under Three Common Models
-
GMP Compliance Essentials for Pharma Cartoning Lines and Automation Strategies
-
ROI Case Studies of Packaging Automation in Food & Consumer Goods
-
From Cartoning to Case Packing: The Complete Path to End‑of‑Line Automation