How to evaluate the true cost of downtime in packaging operations
A packaging line supervisor we spoke with recently put it bluntly: “We bought a cartoner that hit the rated speed on paper, but in real production it became the bottleneck of the entire line.” His frustration is not uncommon. The gap between theoretical machine speed and actual productive output is often filled by one culprit: downtime. Whether it is a jam during a format change, a misfeed that stops the line, or a slow adjustment between batches, these interruptions carry a cost that rarely appears on a purchase quotation.
This article provides a framework for calculating the true financial impact of packaging line downtime and explains which equipment characteristics directly influence your actual runtime.
Beyond Sticker Price: Why “Rated Speed” Is a Misleading Metric
When comparing automatic packaging equipment, the first number buyers often look at is the rated speed—for example, “up to 600 cartons per minute.” However, this number is typically achieved under ideal laboratory conditions: continuous operation, perfect materials, no changeovers, and a skilled technician standing by. Your production floor is not a laboratory.
The metric that actually matters is actual productive output per shift, which is calculated as:
Actual Output = (Total Shift Time – Total Downtime) × Sustainable Operating Speed
Total downtime includes planned stoppages (changeovers, cleaning, maintenance) and unplanned stoppages (jams, misfeeds, sensor errors, component failures). A machine rated at 600 cartons/min that suffers 90 minutes of downtime per shift and runs at 80% of rated speed due to frequent small jams may actually produce fewer cartons than a machine rated at 400 cartons/min with only 20 minutes of downtime and 95% speed consistency.
A 2021 study published in the Journal of Pharmaceutical Innovation found that unplanned downtime accounts for between 5% and 20% of total available production time in high-speed packaging environments, with changeovers and material-related stoppages representing the two largest categories. The same research noted that facilities implementing systematic downtime tracking reduced their unplanned stoppages by an average of 34% within six months—not by buying faster machines, but by identifying the root causes of interruptions.
Five Components of the True Cost of Downtime
Most manufacturers only consider direct labor costs when calculating downtime expenses. In reality, the full financial impact extends across five distinct categories.
| Cost Component | What It Includes | How to Calculate (Example) |
|---|---|---|
| 1. Direct Labor & Idle Assets | Operators waiting, supervisors troubleshooting, machinery not producing | (Hourly wages × downtime hours) + (depreciated equipment cost per hour × downtime) |
| 2. Lost Production Margin | Products that could have been sold but were not made | (Units not produced due to downtime) × (profit margin per unit) |
| 3. Material Waste | Cartons, blisters, leaflets, and product scrapped during jams or restarts | (Scrap per stoppage) × (number of stoppages) × (material cost per unit) |
| 4. Overtime & Catch-Up Costs | Expedited shipping, overtime shifts, or weekend runs to meet deadlines | (Overtime premium × hours) + (expedited freight charges) |
| 5. Secondary Impact | Missed delivery penalties, customer dissatisfaction, expedited changeovers for rush orders | Harder to quantify but often exceeds direct costs in contract packaging |
To put this into perspective, consider a mid-size pharmaceutical contract packager running a single cartoning line. If that line experiences 60 minutes of unplanned downtime per 8-hour shift (12.5% downtime), and the line’s fully burdened operating cost (labor, depreciation, overhead) is $500 per hour, each shift loses $500 in direct idle costs. If that line also loses the opportunity to produce 10,000 cartons per shift, and each carton contributes $0.10 in profit, another $1,000 of lost margin is added. Over 200 operating days per year, that single line’s downtime cost exceeds $300,000. Multiply this across multiple lines, and the business case for downtime reduction becomes clear.
How Equipment Design Directly Impacts Your Uptime
Not all downtime is created equal, and not all of it is the operator’s fault. Certain machine design characteristics have an outsized impact on your ability to stay running. When evaluating packaging equipment, focus on these three design areas.
1. Quick Changeover Capability
For manufacturers running multiple SKUs, changeover time is often the largest single source of downtime. Traditional machines may require 60–120 minutes to switch carton sizes, involving wrenches, partial disassembly, and trial runs. Machines designed for rapid changeover use tool‑free adjustments, independent guide rails, and digital position indicators to complete the same changeover in 15–25 minutes.
The financial impact: If you perform four changeovers per day, reducing changeover time from 90 minutes to 20 minutes reclaims 280 minutes (over 4.5 hours) of productive time daily. At $500 per hour line cost, that is over $2,200 per day—or more than $500,000 annually.
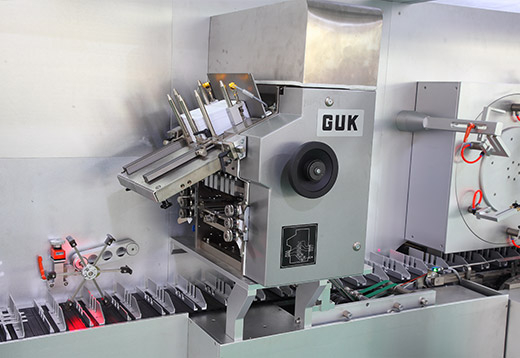
2. Reliable Feeding and Rejection Systems
A significant portion of unplanned downtime comes from product or carton feeding errors. A misfed blister pack or a slightly warped carton can trigger a stop, requiring operator intervention. Advanced cartoners address this with servo-driven synchronized feeding, optical sensors that detect issues before they cause jams, and non-conforming product rejection gates that eject faulty items without stopping the line.
The financial impact: Reducing unplanned stops from ten per shift (each costing 5 minutes of downtime and material waste) to two per shift reclaims 40 minutes of runtime. More importantly, it reduces the frustration that leads operators to run machines at artificially slow speeds to “avoid problems.”
3. Predictive Diagnostics and Maintenance Alerts
The most expensive downtime is the kind you did not see coming. Modern PLC-controlled machines with HMI interfaces can provide real-time production statistics, component wear monitoring, and diagnostic alerts that warn operators before a failure occurs. This transforms maintenance from reactive (“the machine broke, now we wait for a service call”) to preventive (“the system indicates the folding belt needs replacement next week, schedule it during planned cleaning”).
The financial impact: An unexpected major failure might cause 4–8 hours of downtime. A predictive alert that prevents that failure by enabling planned replacement during a scheduled 30-minute maintenance window saves nearly an entire shift of production.
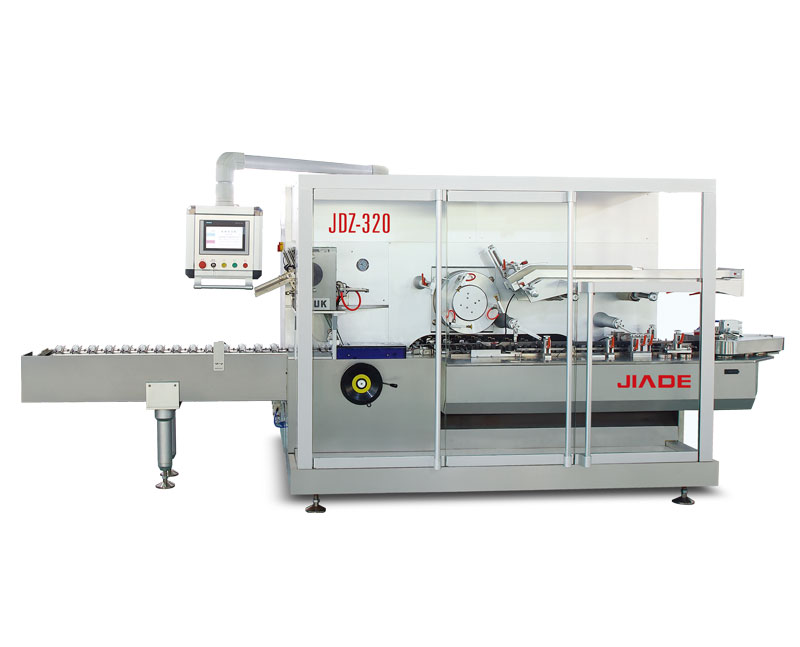
To see how these design principles are implemented in actual equipment, you can explore the continuous and full-servo automatic cartoning machines that prioritize reliability and quick changeover for high-uptime operations.
A Practical Framework: Calculating Your Own Downtime Cost
You do not need a consultant to perform an initial downtime cost assessment. Follow these four steps to build a baseline for your packaging line.
Step 1: Track Your Stoppages for One Week
For each shift, record every time the line stops for more than two minutes. Note the duration, the cause (changeover, jam, misfeed, sensor error, material issue, maintenance, etc.), and the number of cartons or products scrapped during restart. A simple log sheet or whiteboard is sufficient to start.
Step 2: Categorize and Total Your Downtime
At the end of the week, sum the total minutes lost by category. For most packaging operations, you will find that 80% of downtime comes from 20% of the causes—typically changeovers, feeding jams, and material-related stops.
Step 3: Calculate Your Hourly Line Operating Cost
Include direct labor (operators, supervisors), allocated overhead (facility, management), equipment depreciation or lease cost, and a reasonable allocation of quality assurance and maintenance resources. A simple formula is: Hourly Cost = (Total annual line operating budget) ÷ (Annual planned operating hours).
Step 4: Apply the Cost Formula
Annual Downtime Cost = (Total annual downtime hours) × (Hourly line cost) + (Units scrapped annually) × (Material cost + lost profit per unit)
Once you have this number, you have a baseline. The next question becomes: what reduction is realistically achievable with better equipment or process improvements?
Real-World Scenario: Two Machines, Two Very Different Downtime Profiles
Consider two hypothetical cartoning lines producing the same pharmaceutical blister packs with similar batch sizes.
| Factor | Machine A (Traditional) | Machine B (Flexible Design) |
|---|---|---|
| Rated speed (cartons/min) | 450 | 350 |
| Average changeover time | 90 min | 20 min |
| Unplanned stops per shift | 8–12 | 2–3 |
| Average stop duration | 6 min | 3 min |
| Sustainable operating speed | 70% of rated (315/min) | 90% of rated (315/min) |
| Actual output per 8-hour shift | ~45,000 cartons (after downtime) | ~65,000 cartons (after downtime) |
Despite Machine B having a lower rated speed, its superior uptime and speed consistency produce 44% more actual output per shift. The total cost of ownership—including downtime—favors Machine B, even if its purchase price is comparable or slightly higher.
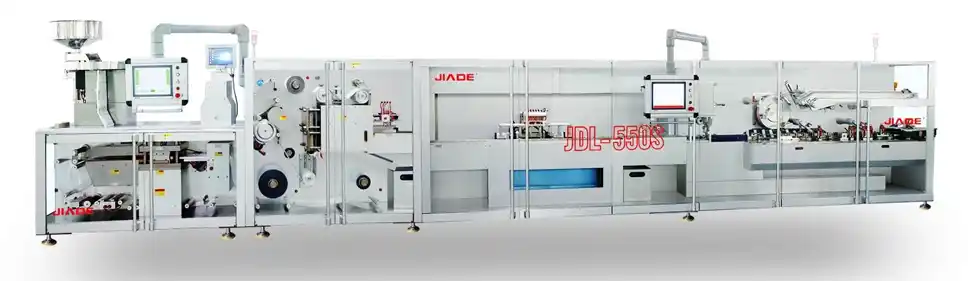
For a deeper look at how integrated line configurations—such as blister and cartoning combined systems—reduce downtime by eliminating transfer points and synchronizing upstream and downstream equipment, you can review these solution architectures designed for pharmaceutical production.
Next Steps: From Downtime Calculation to Equipment Evaluation
By now, you should have a clear framework for calculating what downtime actually costs your operation. You also understand which equipment design characteristics—quick changeover, reliable feeding, predictive diagnostics—directly influence your uptime. The next logical step is to apply this framework to your existing line or to the specifications of machines you are considering for purchase.
When you speak with equipment suppliers, come prepared with your downtime baseline. Ask specific questions: “What is your machine’s average changeover time for a standard carton size change?” “How does your feeding system handle misfeeds without stopping the line?” “What diagnostic data does your HMI provide to predict maintenance needs?” A supplier who cannot answer these questions is likely selling rated speed, not productive uptime.
Once you have established which uptime characteristics are most critical for your product mix and shift structure, you can compare the full range of cartoning and blister packaging equipment to see which series align with your operational priorities. For facilities looking to build a complete, high-uptime line from primary packaging through secondary bundling, exploring one-stop customized packaging solutions can provide a holistic view of how integrated equipment designs reduce cumulative downtime across the entire production process.
Related Reading
-
How to choose an automatic cartoner for small batches and quick changeover
-
Designing a blister-to-carton line that minimizes transfer-related stops
-
Understanding the role of servo synchronization in maintaining speed consistency
-
Key GMP considerations for validation of high-uptime packaging equipment
-
Building a financial business case for flexible vs dedicated packaging assets